How To Use The Pugh Matrix
What is it?
The Pugh Matrix was developed by Stuart Pugh who was a professor and head of the design division at the University of Strathclyde in Glasgow.
It is also called a variety of names including Pugh method, Pugh analysis, decision matrix method, decision matrix, decision grid, selection grid, selection matrix, problem matrix, problem selection matrix, problem selection grid, solution matrix, criteria rating form, criteria-based matrix, opportunity analysis.
As a decision making model, it is obviously used to choose between a list of alternatives.
The most important criteria in the decision are chosen, and the alternatives are compared using these criteria.
There are variations and how to use the criteria and we will look at those later on.
Who uses it?
Is typically used in teams can just as easily be used by individuals. An interesting variation in team decision-making is for each individual to create his own pew matrix and then as a team the Pugh matrices are compared.
What for?
Typically, a Pugh matrix is used to evaluate various alternatives against a baseline. For example, a company has five alternative processes to the one it's using, and it wants to know if any of the five is better or not.It is also used when only one solution is possible, only one product can be brought to market, has only sufficient financing for one solution or where the optimal alternative is required, and you are deciding on the basis of multiple criteria.
It can also be used where there are many alternatives, none of which are quite suitable. The Pugh matrix can be used to choose the best aspects of the various concepts to produce a hybrid, which hopefully will be better than the alternatives used initially.
A Pugh matrix example
Let's say we're deciding between four alternatives, A, B, C, D. We already have a system in place and want to know if one of these four systems would be better for us.
We decide what our criteria are. We pick the four most important, the ones that absolutely must be included. Let's call them 1,2,3 and 4. (These can be price, time, ease of production, man-hours, whatever is most important. In companies, for example, they may get the customer/client involved here to ensure their satisfaction with the end result).
Let's draw our Pugh matrix. We put the alternatives across the top, and we are going to assess these with respect to the criteria, which we draw in on the left.
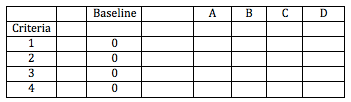
Our baseline is the system we have in place at the moment, so we score this a nought against our criteria. Our diagram will look like this.
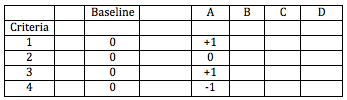
Now consider option A. In relation to criteria 1, do we consider that it is better, the same as, or worse than the baseline? If it's better we give it a +1, if it's the same we give it a 0, and if it's worse we give it a -1. Let's say it's +1.
In terms of criteria 2, it's the same as the baseline. For criteria 3 it's better, and for criteria 4 its worse.
Our chart now looks like this.
We assess each of the alternatives B, C and D in the same way, filling in all the blanks.
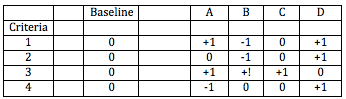
So now we know the number of pluses, the number of minuses and the total score for each alternative, allowing us to make a more rational or objective decision. In this case it's obviously D, with three pluses and no minuses.
Weighting
We can also give each criterion a weighting. For example, if our first criteria is a 2, and the second criteria is twice as important we give that a four. The third criteria is somewhere in between, so it's a three. And the last criteria is probably the most important so that it gets a five. (It was funny writing that!!)
Our chart now looks like this.
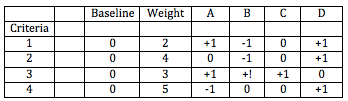
Criteria 1 has a weighting of two. So all the numbers to the right of it are multiplied by two. Criteria four has a weighting of 5, so it's results are multiplied by five, etc.
Our Pugh matrix example now looks like this:
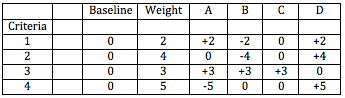
In our case the end result is the same, but depending on the number of criteria and the variables, the weighting you use can cause very different end results.
A further variation
Instead of the three-point scale we have used here, it it possible to use a five-point scale. For example:- +2 - much better than
- +1 - better than
- 0 - equal to
- -1 - worse than
- -2 - much worse than
This can even be a 7 point scale, but anything finer may just complicate things unnecessarily.
Other rational decision models
See here for more rational decision making modelsLike this page?
Mind Control
You have probably noticed that I am moving the whole Mind Control section to a new site. Please excuse any inconvenience.
This is the new site www.pschobegone.com. Feel free to come and visit. Any suggestions will be gratefully received!